Jmeter
Thursday, July 6, 2017
Thursday, February 23, 2017
jmeter scenarios
- Calculate Average, Min and max response time.
- Calculate Number of Transactions with response time >300 ms, <300 ms
- Calculate the % of Error responses.
- Break the server:
- Source: http://stackoverflow.com/questions/39507765/response-code-non-http-response-code-java-net-connectexception-response-messag
- I am executing one script using Jmeter for load testing.I am getting error in between lets say for eg. If I applied load of 500users, till 250 users threads are running successfully then error comes of connection timed out error.Then, again it running successful for some of threads then error.
- Code is as follow:-
- Thread Name: Thread Group 1-1274
- Sample Start: 2016-09-15 15:02:13 IST
- Load time: 21004
- Connect Time: 21004
- Latency: 0
- Size in bytes: 2206
- Headers size in bytes: 0
- Body size in bytes: 2206
- Sample Count: 1
- Error Count: 1
- Data type ("text"|"bin"|""): text
- Response code: Non HTTP response code: java.net.ConnectException
- Response message: Non HTTP response message: Connection timed out: connect
- Response headers:
- HTTPSampleResult fields:
- ContentType:
- DataEncoding: null
- I need to break the server.
- Can anyone help me for this?
Latency and its role....
Latency is the delay from input into a system to desired outcome; the term is understood slightly differently in various contexts and latency issues also vary from one system to another. Latency greatly affects how usable and enjoyable electronic and mechanical devices as well as communications are.
Wednesday, February 22, 2017
Questions on Jmeter
- I have set jmeter to run for 4 hours, its been 2 hours I started it is running with no issues.Can I stop it in the middle, as 4 hours will be very long time. Can I still use the results, by interrupting it after 3 hours or so. Plz let me know.
- Sol: You can. But the distribution by load balancer is 4 hrs. Your output will not be ok or accurate.
Tuesday, February 21, 2017
TPS??
- TPS - is Transactions Per Second.
- But how to set up TPS?
- What does it mean to set up TPS. Generally TPS is part of requirement like client will need performance of application with specific TPS. He gives the TPS, accordingly we need to perform testing.
Ex:
Results format: Screen will have following details once script kick starts and finishes:
|
Duration of Test in
Seconds
|
No of Request
|
Avg. Tps
|
Response Time in
milliseconds
|
|
|
Error count
|
|
|
|
|
Average
|
Minimum
|
Maximum
|
|
|
14400s
|
940926
|
65.7/s
|
49
|
1
|
4106
|
796
|
|
|
|
|
|
|
|
|
Throughput
Throughput:
Request is sent in packets using different protocols(HTTPS,…). Since packets
can have multiple bandwidth, here throughput is number of requests that could
be passed in one packet.
Thursday, February 16, 2017
Step by Step process to run jmeter script or Performance testing
- You could run jmeter in two ways:
- Run Jmeter from Cluster
- jmeter is located on the cluster.
- Should run jmeter through putty, below is the command for the same:
- /..<parent folder path of jmeter software>../apache-jmeter-3.0/bin/jmeter -n -t /..<parent folder path of jmeter script>../<name of the script file>.jmx -l /..<parent folder path of csv file>../<results file name>.csv
- As soon as you run the jmeter script, you will see results scrolling in putty.
- So using this way of running script, you could only see the results and you will not be able to edit the script.
- You will not be able edit the script. As you will not be able to see GUI.
- This is effective, because you could see actual load on the application.
- Run Jmeter from GUI(from local jmeter software)
- jmeter located on local machine, if not
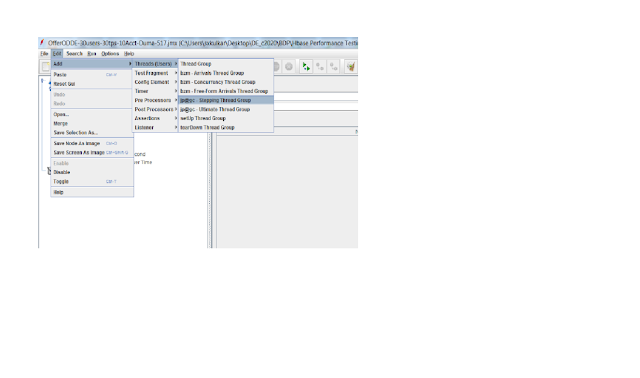
- In the Test Plan, right click and add below mentioned thread group.
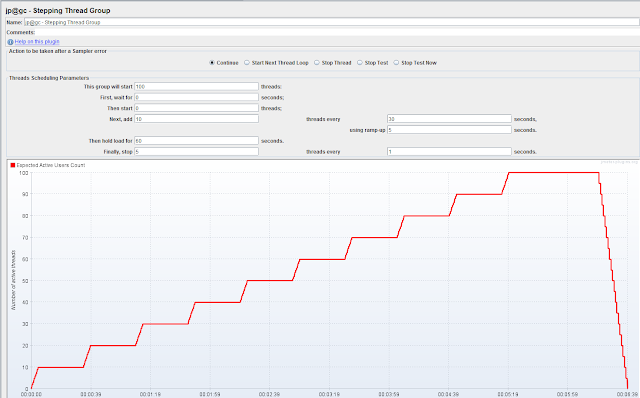
- To the test plan add "SteppingThread group":
- Fields:
- This group will start ..... Threads <Give 300, it means that 300 threads will run constantly for time mentioned in "then hold for ... seconds">
- First, wait for .... seconds <wait time before adding the threads mentioned in "then start >
- Then start ... Threads <After "First, wait for ... seconds" then start with number of threads mentioned here>
- Next, add ... Threads every .... seconds <keep adding mentioned threads every mentioned seconds>
- Then hold load for ..... seconds < Mentioned the time till which you will want 300 threads to be hold>
- Finally stop ... threads every ...... seconds < Once you reached hold time, finally stop mentioned threads every mentioned seconds, kind of ramping down>
- Ex from live env: We use 300 threads that has to be constant for almost 4 hours. We get results for this thread setting.
- Adding "Sampler - HTTP Request" under Stepping Thread group:Here OfferODDE is the name of the HTTP Request Sampler
- Fields:
- Name : Name given to the script
- Server Name: The text till ".com" at the beginning of end point url.
- Implementation: HPPTClient4
- Protocol: https
- Method: POST
- Path: Is something after ".com"
- Body: Is where you have your complete request. Remember if something is parameterised, it should be this format: "${varl}"
- Adding "HTTP Header Manager" under Sampler:

- Adding CVS Dataset Config:
- Right click on Sampler -> Add -> Config Element -> CVS Data set Config
- Fields:
- Filename: Is the path of cvs file(including name). You can just mention the name if the file located in bin folder.
- Variable name: Names of variables that are used in the script. And the variable names will go with the order of data in the csv file. And same names should be used in the script.
- Adding View Results Tree:
- Add -> Listner -> View Results Tree
- Fields
- Name: Name for the results
- File Name: Path of the results file (mostly csv format)
- Adding Aggregate report:
- Following 3 tests need to performed:
- Without any Hbase load running in the background.
- With Old batch job running.
- With new batch job running.
Subscribe to:
Comments (Atom)


