Thursday, July 6, 2017
Thursday, February 23, 2017
jmeter scenarios
- Calculate Average, Min and max response time.
- Calculate Number of Transactions with response time >300 ms, <300 ms
- Calculate the % of Error responses.
- Break the server:
- Source: http://stackoverflow.com/questions/39507765/response-code-non-http-response-code-java-net-connectexception-response-messag
- I am executing one script using Jmeter for load testing.I am getting error in between lets say for eg. If I applied load of 500users, till 250 users threads are running successfully then error comes of connection timed out error.Then, again it running successful for some of threads then error.
- Code is as follow:-
- Thread Name: Thread Group 1-1274
- Sample Start: 2016-09-15 15:02:13 IST
- Load time: 21004
- Connect Time: 21004
- Latency: 0
- Size in bytes: 2206
- Headers size in bytes: 0
- Body size in bytes: 2206
- Sample Count: 1
- Error Count: 1
- Data type ("text"|"bin"|""): text
- Response code: Non HTTP response code: java.net.ConnectException
- Response message: Non HTTP response message: Connection timed out: connect
- Response headers:
- HTTPSampleResult fields:
- ContentType:
- DataEncoding: null
- I need to break the server.
- Can anyone help me for this?
Latency and its role....
Latency is the delay from input into a system to desired outcome; the term is understood slightly differently in various contexts and latency issues also vary from one system to another. Latency greatly affects how usable and enjoyable electronic and mechanical devices as well as communications are.
Wednesday, February 22, 2017
Questions on Jmeter
- I have set jmeter to run for 4 hours, its been 2 hours I started it is running with no issues.Can I stop it in the middle, as 4 hours will be very long time. Can I still use the results, by interrupting it after 3 hours or so. Plz let me know.
- Sol: You can. But the distribution by load balancer is 4 hrs. Your output will not be ok or accurate.
Tuesday, February 21, 2017
TPS??
- TPS - is Transactions Per Second.
- But how to set up TPS?
- What does it mean to set up TPS. Generally TPS is part of requirement like client will need performance of application with specific TPS. He gives the TPS, accordingly we need to perform testing.
Ex:
Results format: Screen will have following details once script kick starts and finishes:
|
Duration of Test in
Seconds
|
No of Request
|
Avg. Tps
|
Response Time in
milliseconds
|
|
|
Error count
|
|
|
|
|
Average
|
Minimum
|
Maximum
|
|
|
14400s
|
940926
|
65.7/s
|
49
|
1
|
4106
|
796
|
|
|
|
|
|
|
|
|
Throughput
Throughput:
Request is sent in packets using different protocols(HTTPS,…). Since packets
can have multiple bandwidth, here throughput is number of requests that could
be passed in one packet.
Thursday, February 16, 2017
Step by Step process to run jmeter script or Performance testing
- You could run jmeter in two ways:
- Run Jmeter from Cluster
- jmeter is located on the cluster.
- Should run jmeter through putty, below is the command for the same:
- /..<parent folder path of jmeter software>../apache-jmeter-3.0/bin/jmeter -n -t /..<parent folder path of jmeter script>../<name of the script file>.jmx -l /..<parent folder path of csv file>../<results file name>.csv
- As soon as you run the jmeter script, you will see results scrolling in putty.
- So using this way of running script, you could only see the results and you will not be able to edit the script.
- You will not be able edit the script. As you will not be able to see GUI.
- This is effective, because you could see actual load on the application.
- Run Jmeter from GUI(from local jmeter software)
- jmeter located on local machine, if not
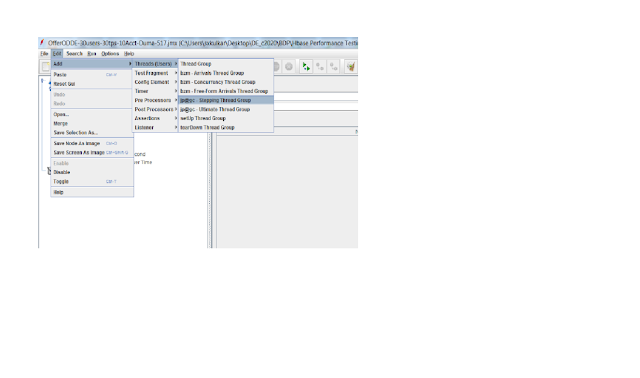
- In the Test Plan, right click and add below mentioned thread group.
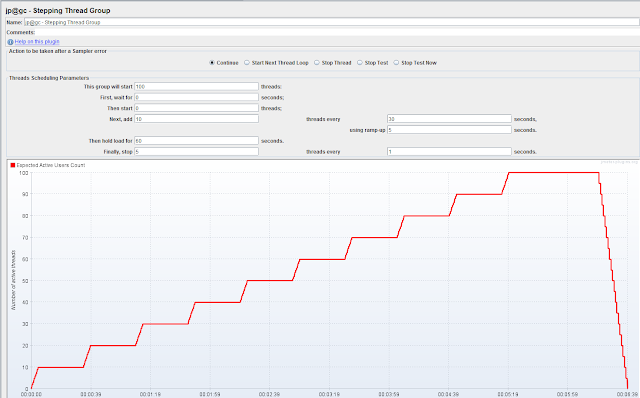
- To the test plan add "SteppingThread group":
- Fields:
- This group will start ..... Threads <Give 300, it means that 300 threads will run constantly for time mentioned in "then hold for ... seconds">
- First, wait for .... seconds <wait time before adding the threads mentioned in "then start >
- Then start ... Threads <After "First, wait for ... seconds" then start with number of threads mentioned here>
- Next, add ... Threads every .... seconds <keep adding mentioned threads every mentioned seconds>
- Then hold load for ..... seconds < Mentioned the time till which you will want 300 threads to be hold>
- Finally stop ... threads every ...... seconds < Once you reached hold time, finally stop mentioned threads every mentioned seconds, kind of ramping down>
- Ex from live env: We use 300 threads that has to be constant for almost 4 hours. We get results for this thread setting.
- Adding "Sampler - HTTP Request" under Stepping Thread group:Here OfferODDE is the name of the HTTP Request Sampler
- Fields:
- Name : Name given to the script
- Server Name: The text till ".com" at the beginning of end point url.
- Implementation: HPPTClient4
- Protocol: https
- Method: POST
- Path: Is something after ".com"
- Body: Is where you have your complete request. Remember if something is parameterised, it should be this format: "${varl}"
- Adding "HTTP Header Manager" under Sampler:

- Adding CVS Dataset Config:
- Right click on Sampler -> Add -> Config Element -> CVS Data set Config
- Fields:
- Filename: Is the path of cvs file(including name). You can just mention the name if the file located in bin folder.
- Variable name: Names of variables that are used in the script. And the variable names will go with the order of data in the csv file. And same names should be used in the script.
- Adding View Results Tree:
- Add -> Listner -> View Results Tree
- Fields
- Name: Name for the results
- File Name: Path of the results file (mostly csv format)
- Adding Aggregate report:
- Following 3 tests need to performed:
- Without any Hbase load running in the background.
- With Old batch job running.
- With new batch job running.
Thursday, January 26, 2017
Read jmeter Results (Non Gui mode)
If you look at the above screens, load started with some 20 active users then once it reached 300, it remain constant for some time and then the users are removed so that again it reaches 0.
During this process you will see below field values:
Summary Timetaken Req/sec Avg(response) Min(response) Max(Response) Err(%)
Summary - No.f o requests submitted till now.
Timetaken - Time completed till now
Req/sec - No. of requests submitted per sec. Here it is 64.9/s
Avg - Average response time. Here it is 759 mill sec i,e 0.7 Responses/sec
Min - Response with less Response time is 2 mill sec.
Max - Response with max response time is 33057 mill sec
Err - No. of requests that has error response. Here it is 141. 0.10% when compared with 100% reqs.
Test Results (10 TPS):
Duration of Test in Seconds
|
No of Request
|
Avg. Tps
|
Response Time in milliseconds
|
Error count
|
No. of Request with response Time>300ms
|
SLA Breach % for 300ms
|
No. of Request with response Time>500ms
|
SLA Breach % for 500ms
|
No. of Request with response Time>700ms
|
SLA Breach % for 700ms
|
||
Average
|
Minimum
|
Maximum
|
||||||||||
Wednesday, January 25, 2017
jmeter on GUI mode
1/25/17
jmeter on GUI mode is something that you will not see GUI(interface), so for non GUI mode you have run jmeter from server.
Command to run jmeter from server(command prompt) is:
<jmeter software path> -n -t <jmeter script path> -l <jmeter results folder file path>
Ex:
Friday, January 20, 2017
Parameterization using csv file in jmeter
Source: http://ivetetecedor.com/how-to-use-a-csv-file-with-jmeter/
Thursday, January 19, 2017
Errors faced with Jmeter
- Getting error "problem loading xml" when try to open .jmx file in Jmeter
- Solution: http://jmeter.512774.n5.nabble.com/Problem-loading-XML-td5722816.html ----- worked
- Explanation:
- Your test plan have a Stepping ThreadGroup sampler.This sampler comes from jmeter plugins (jp@gc).If you try to open a test plan where you have this Stepping ThreadGroup included and your jmeter do not have the plugins installed then you cant open the test plan.Please install the plugins then it will work.
- Download SteppingThread plugin(https://jmeter-plugins.org/) and place it it /lib/ext
- SteppingThread:
- JMeter have only one out-of-the-box option for threads (users) scheduling: simple ramp-up. But many users, especially with HP LoadRunner experience miss more flexible thread scheduling algorythm. Stepping Thread Group adds to JMeter thread scheduling similar to LoadRunner's.In JMeter version 2.4 new plugin type was introduced: custom Thread Groups. Stepping Thread Group is the first custom thread group in the world.However, time goes by and probably better alternative has been offered: Concurrency Thread Group
Features
- preview graph showing estimated load (see example screen below)
- initial thread group delay to combine several thread group activities
- increase load by portions of threads (users) with ramp-up period
- configurable hold time after all threads started
- decrease load by portions
- Error while loading TestPlan - "Unexpected Error - see log" --- Java Null Pointer Exception
- Solution: http://nonfunctionaltestingtools.blogspot.com/2015/01/jmeter-error-while-loading-testplan.html --- working
- Explanation:
- Download Extras plug in.
- The JMeterPlugins-Extras contains additional plugins for extended testing and complex testing. Also it does not require additional libraries to run.
- https://loadfocus.com/blog/tech/2015/07/how-to-install-jmeterplugins-extras-and-jmeterplugins-extraslibs/
- Getting error- Target server failed to respond, while running script
org.apache.http.NoHttpResponseException: The target server failed to respond
at org.apache.http.impl.conn.DefaultHttpResponseParser.parseHead(DefaultHttpResponseParser.java:95)
at org.apache.http.impl.conn.DefaultHttpResponseParser.parseHead(DefaultHttpResponseParser.java:61)
at org.apache.http.impl.conn.DefaultHttpResponseParser.parseHead(DefaultHttpResponseParser.java:95)
at org.apache.http.impl.conn.DefaultHttpResponseParser.parseHead(DefaultHttpResponseParser.java:61)
- Solution:
- uncomment hc.parameters.file=hc.parameters in user.properties
- Set this in hc.parameters: http.connection.stalecheck$Boolean=true
- Source: http://jmeter.512774.n5.nabble.com/NoHttpResponseException-td5721811.html
- Getting error: Response code: Non HTTP response code: java.net.ConnectException. Response message: Non HTTP response message: Connection timed out: connect
- Faced this error when the protocol(http) value is "http" instead of "https" (that is in the url used for API)
- Situation: I had a situation where I was asked to change the end point url that had http instead of https.
- Solution: Later I found that if the url has http instead of https, jmeter GUI will not run. Instead you should run jmeter script from the server(from command prompt).
- Sometimes, only some threads will have issue. Trying to hit Rest API web service through Jmeter for a range of users. (20, 30,50,80 users). 80% of the request samples get processed, but around 20% of the samples error out with below message under sampler Result. Source: http://stackoverflow.com/questions/30164200/getting-response-code-non-http-response-code-java-net-connectexception-for-som
- When I run jmeter scirpt on silver/gold, I got this error: Permission Denied ---working fine
Silver:
/axp/open/risksim/dev/skulkar/apache-jmeter-3.0/bin/jmeter
-n -t
/axp/open/risksim/dev/skulkar/Perftesting/Simple_Config_Element_server.jmx -l
/axp/open/risksim/dev/skulkar/Perftesting
O/p:
risksims@lppbd0030[(IPC1-Silver-EDGE)
/axp/open/risksim/dev/skulkar/Perftesting]$ /axp/xxx/apache-jmeter-3.0/bin/jmeter
-n -t
/axp/xxx/Perftesting/Simple_Config_Element_server.jmx -l
/axp/open/xxx/Perftesting
-bash:
/axp/xxx/apache-jmeter-3.0/bin/jmeter: Permission denied
Resolution: Looks like the jmeter does not have right permissions on silver/gold, so need to change the mode using:
chmod 777 filename
Ex: chmod 777 /axp/xxx/apache-jmeter-3.0/bin/jmeter
- Next error after the above one got resolved. When I run jmeter scirpt on silver/gold, I got this error: Waiting for possible Shutdown/StopTestNow/Heapdump message on port 4445
/idn/xxx/apache-jmeter-3.0/bin/jmeter
-n -t
/idn/xxx/apache-jmeter-3.0/scripts/Simple_Config_Element_gold_server.jmx
-l /idn/xxx/apache-jmeter-3.0/Results/CapMgnt_results.csv
Waiting for possible Shutdown/StopTestNow/Heapdump message on port 4445
Subscribe to:
Comments (Atom)


